Its a common topic, Almost all developers are aware of how to debug a plugin.
This Blog will give you a detailed view of debugging a plugin.
Going Back to Basics
Strengthens your foundation.
We all as a developer or automation tester need to debug a plugin to find what exactly is the issue or sometime just to see what data is coming.
Not Every-Time you have issue with your plugin. some time you need to analysis what data is coming in your context or Images or secure config string and So.
Lets Begin…!
Before Debugging,
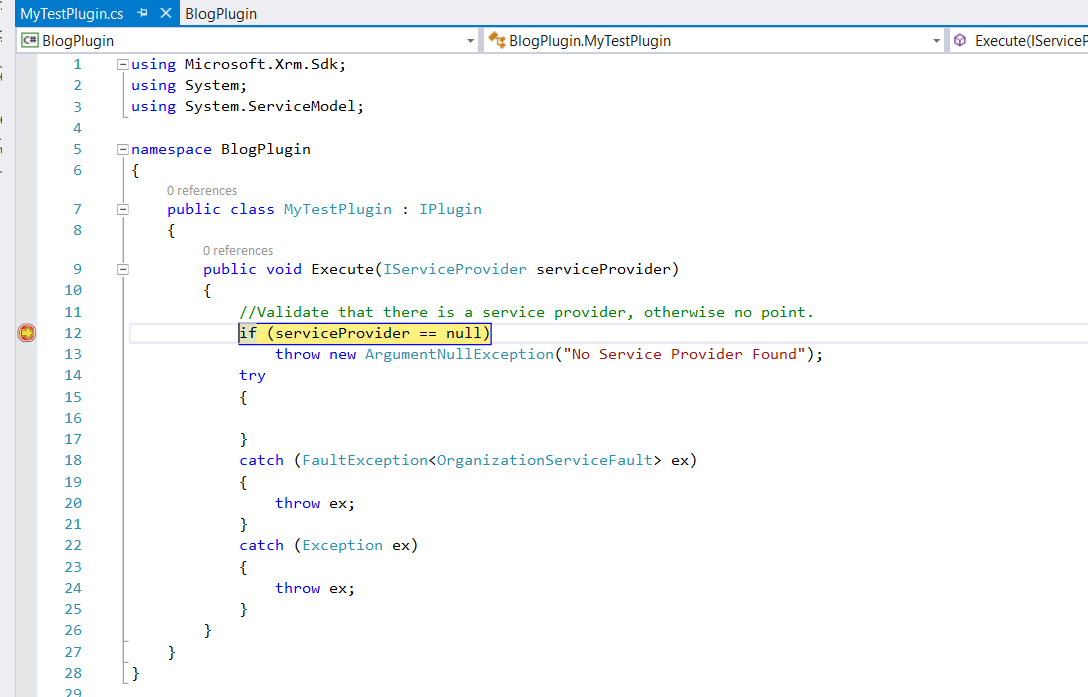
You must know How to Create a plugin and How To register a plugin
Steps Include for Debugging a plugin is
Open Plugin Registration Tool.
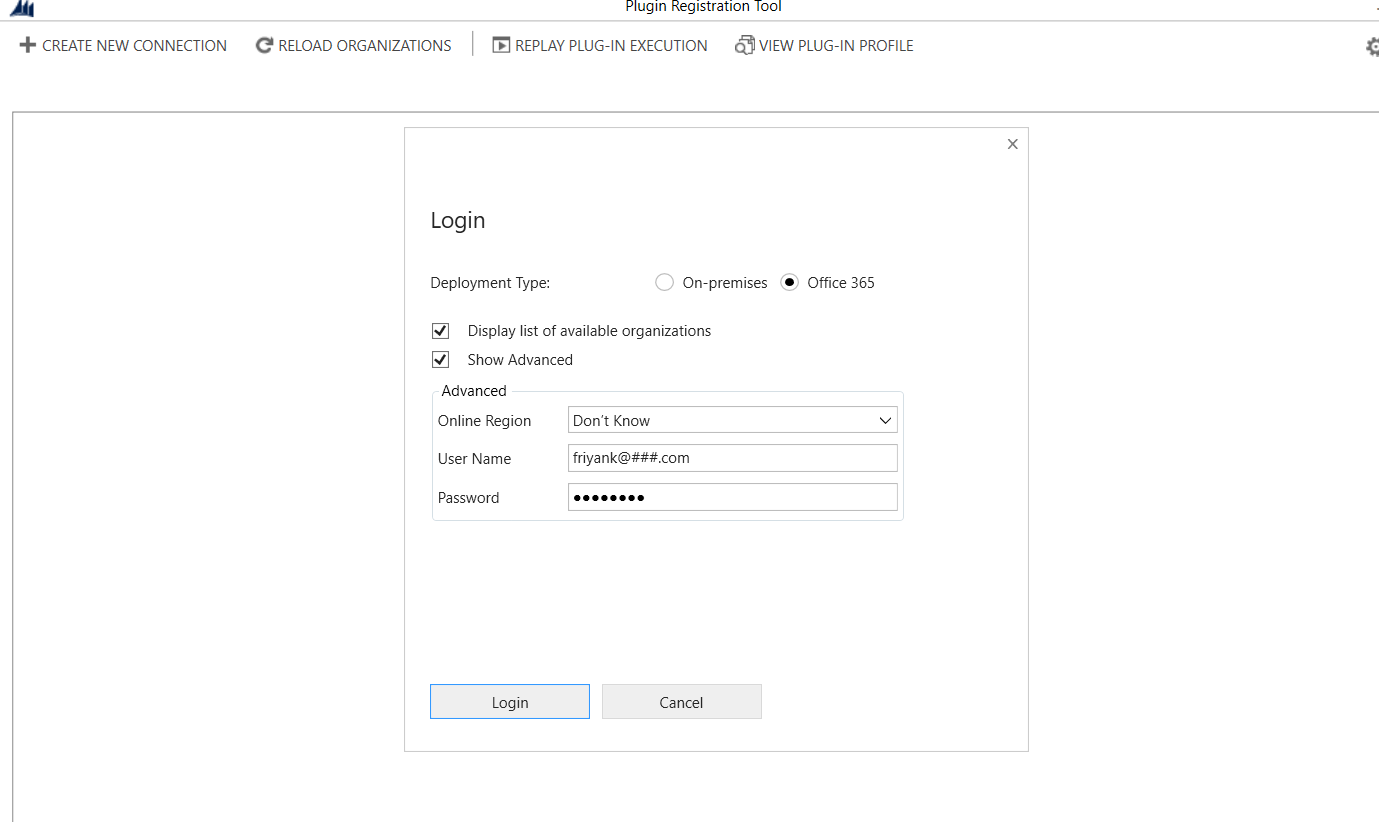
Connect to CRM
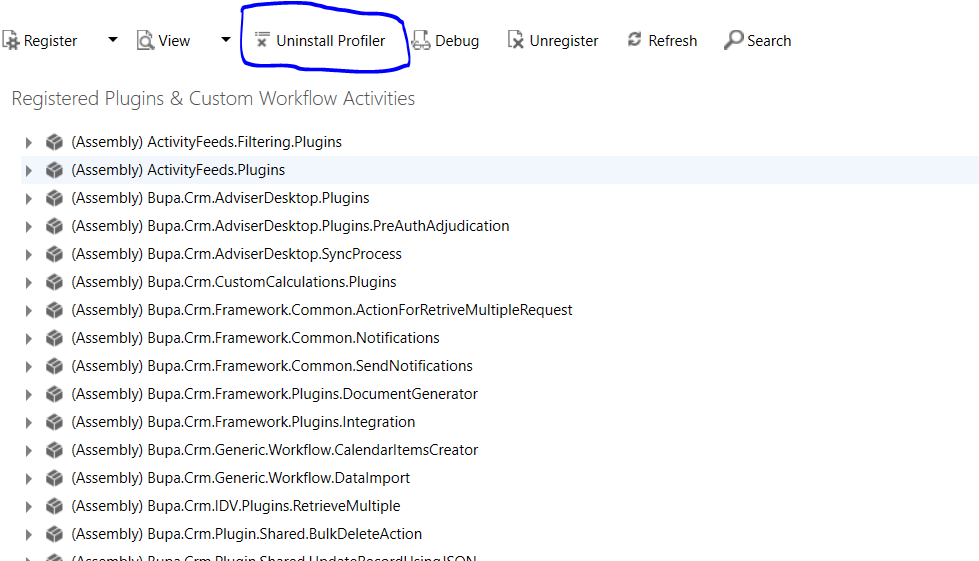
Install Profiler

Check if Profiler is installed
Start Profiling for Specific step.

Select Exception as profile storage, so that you get a pop up like exception is thrown, but this is not exception it is encrypted log file.

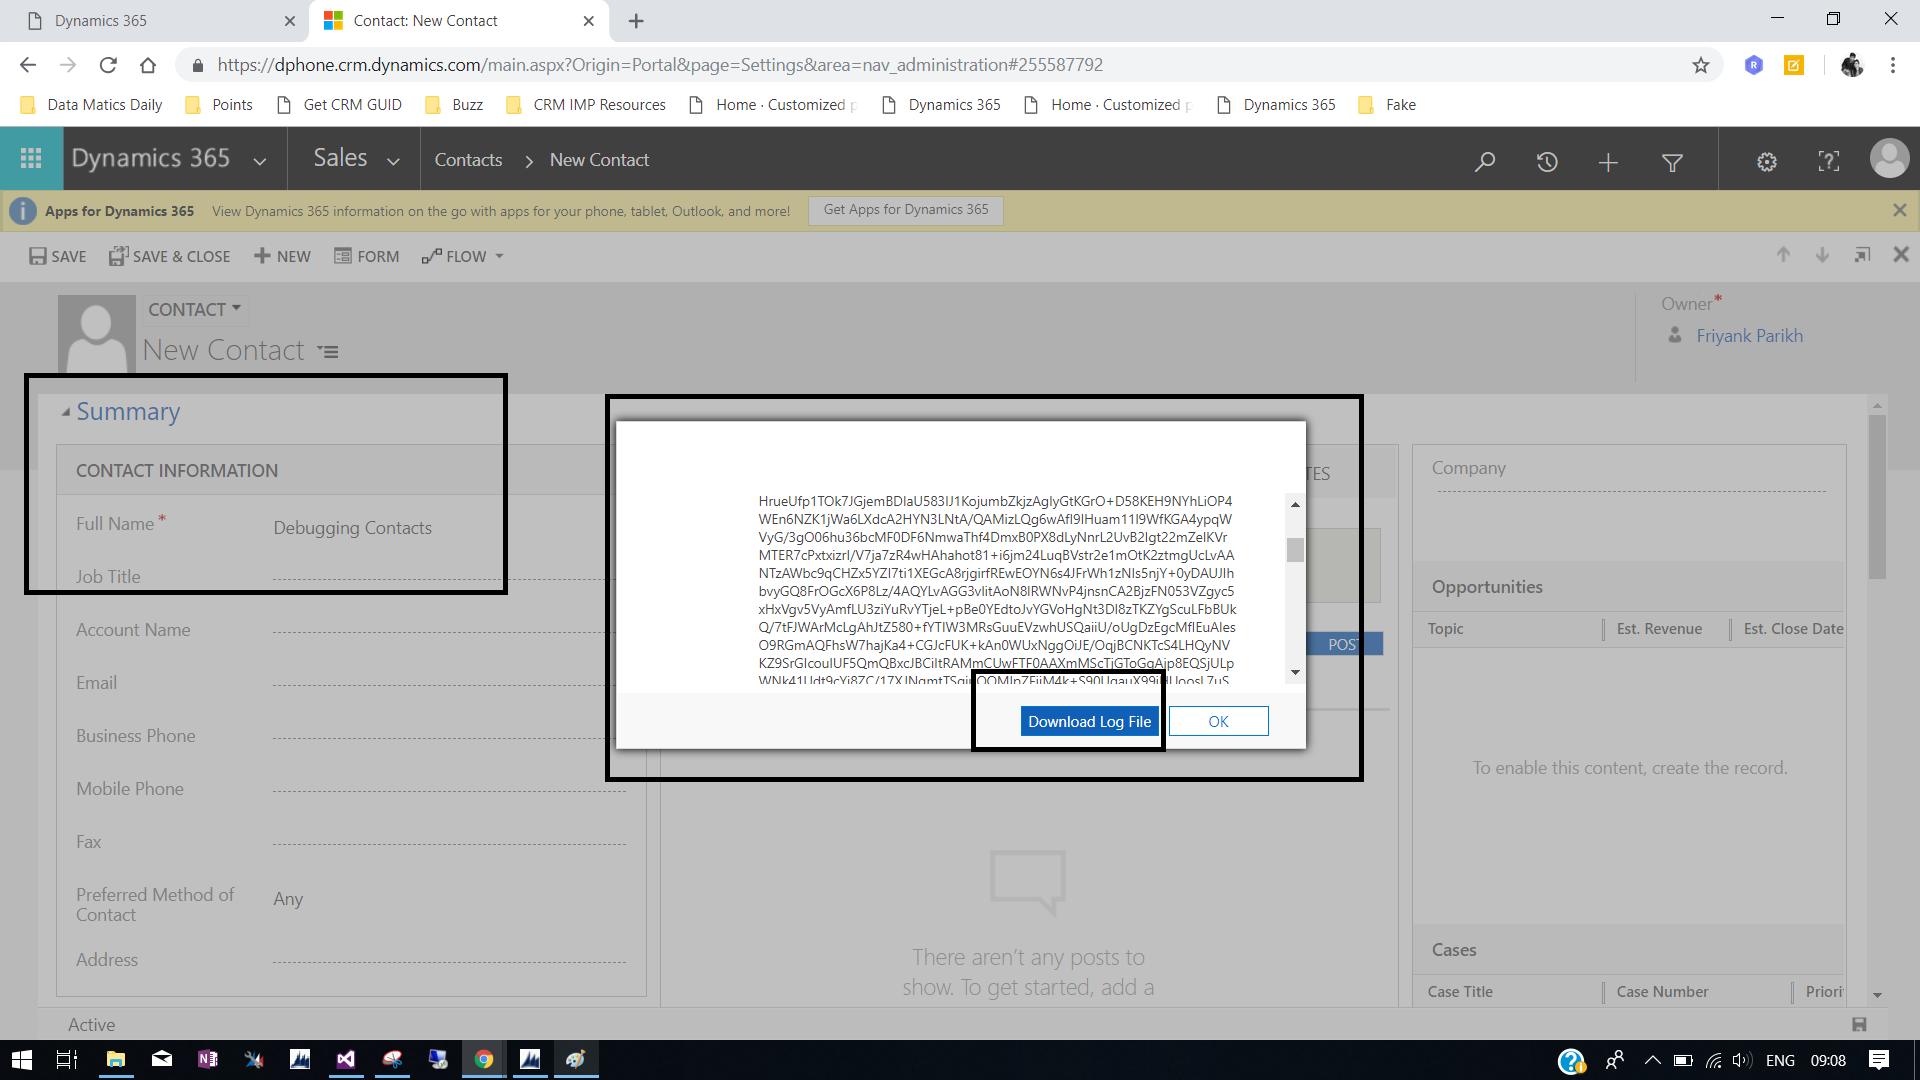
Login to CRM and perform task or message on which plugin is register. for instance Create a contact if plugin is register on plugin creation.

As the Profiler is running, you will get a pop up once you click save and you will get some encoded text displayed and you have option to download the same.
Just download the log.
Now Stop Profiling
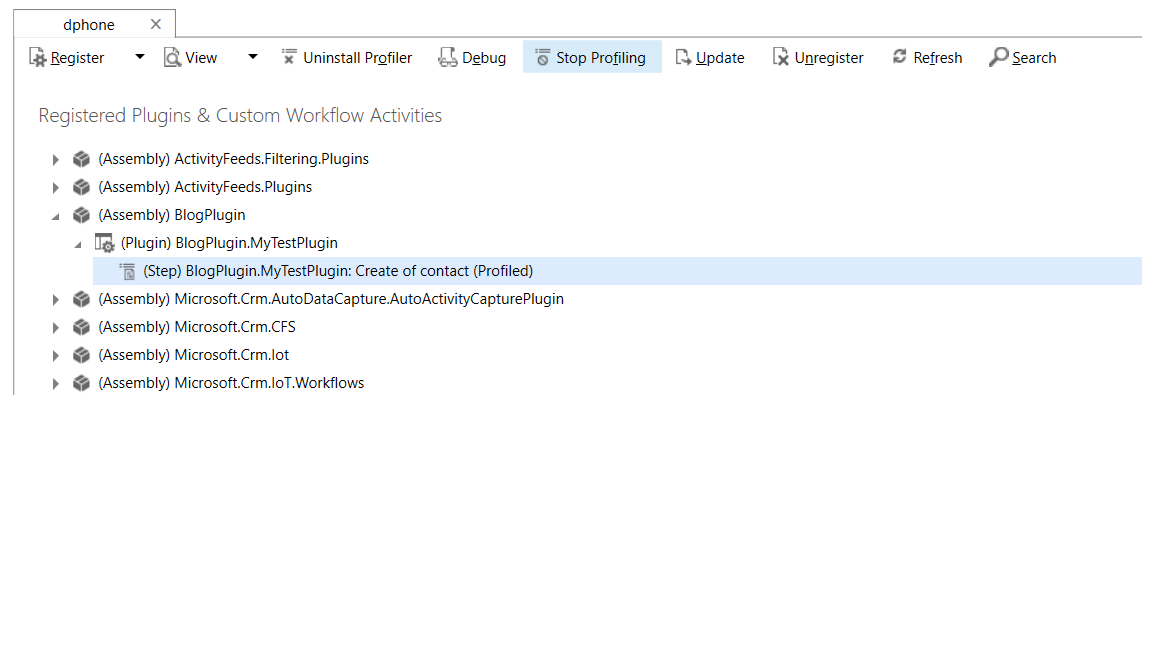
Next step is to again go to, Same step in PRT and Click Debug.
You will be presented with a Replay plugin Execution wizard. Here you have to Provide two things.
In Profile – Browse the Encoded Log file we just downloaded while profiling.
It should be Encoded Log file.
Assembly Location – Specify/Browse the Assembly of plugin we created and Plugin – Select Plugin which you want to Debug

Now Open your Plugin Assembly in visual studio and go to Debug > Attach to Process
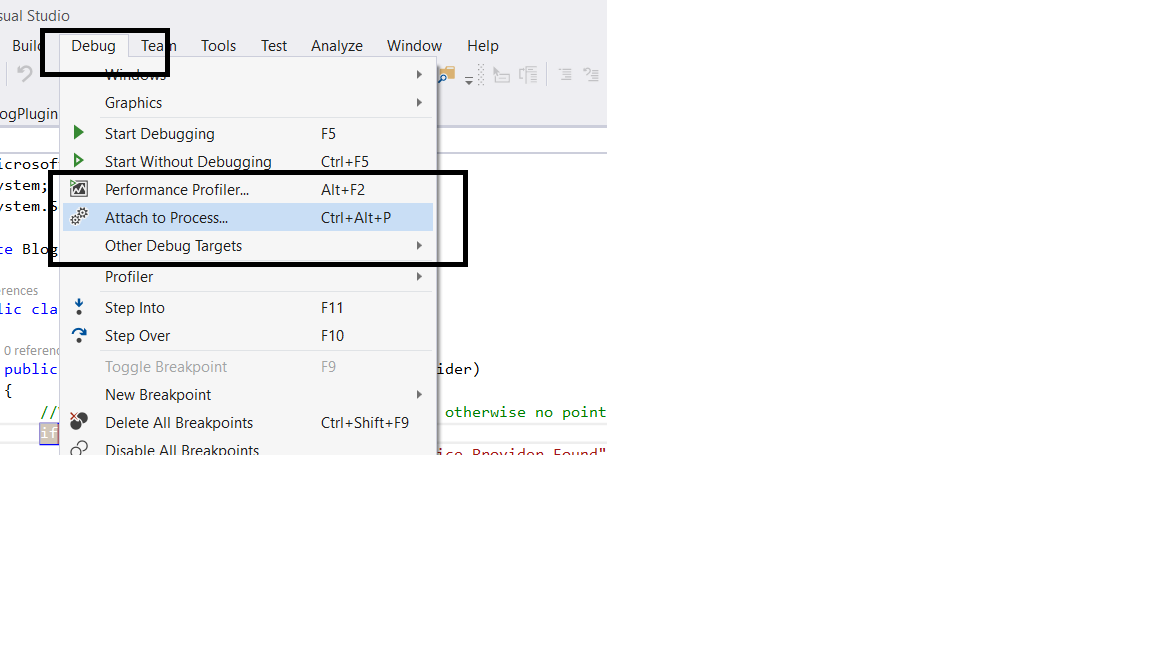
Add Debug break Point Anywhere in Execute method of that Plugin class which we specified in Plugin option.

From the list of Process select Plugin Registration tool and click attach.
Now Go to PRT and click Start Execution.
and Just wait to see Debugging Hit and you will see plugin getting debug.